
My very first semester in the Urban Informatics M.S. program, I started learning a lot of concrete skills: Computational Statistics, the R programming language, how to work with large data sets and derive useful information them, how to convey that data to a general audience. I also learned some more abstract but equally important lessons: when to step back from the data and be guided by what you can see and learn on the ground or through other means, and how data can tell a story.
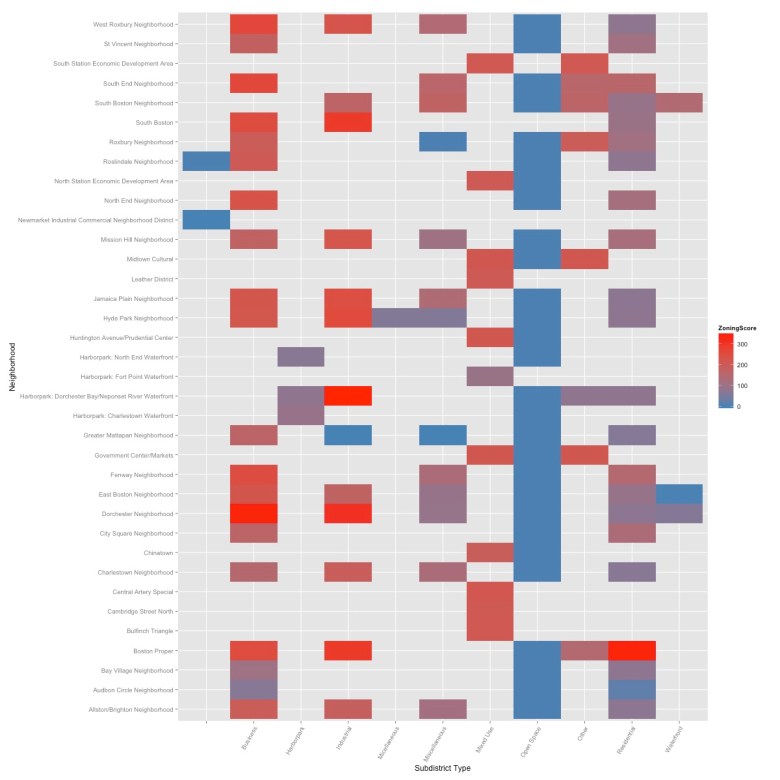
Working all semester with the City of Boston’s Zoning Clearances, I explored Boston’s open spaces. My first move was to create a simple measure I dubbed a Zoning Score. Giving three points for each allowed use in a subdistrict, and one for each conditional use, it is a pretty straightforward measure of how diverse the uses are in a given subdistrict. After a few abortive attempts at plotting this measure visually, I hit on something relatively useful: a ‘heat map’ of zoning scores, showing the districts, which correspond roughly to neighborhoods, on one axis, and the subdistrict types on the other. The scores go from blue on the least diverse end to red on the most diverse. This stripe of solid blue is where I spent the rest of the semester.
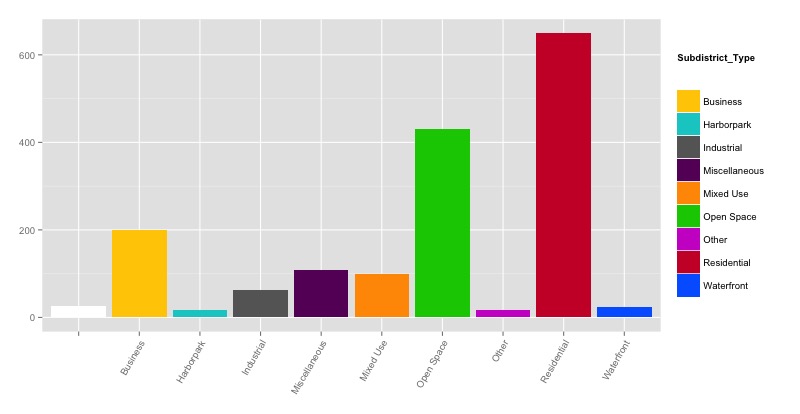
There are 1,637 zoning subdistricts in the City of Boston. Of those 1,637, there are 431 subdistricts with an ‘Open Spaces’ type, more than any other type aside from ‘Residential.’ That’s more than a quarter of all the city’s subdistricts which are zoned ‘Allowed’ for ‘Open Space,’ ‘Conditionally Allowed’ for ‘Recreational Building’ and ‘Forbidden for all other uses.
Over the course of the semester, I visited the improbable urban wilds and wildlife sanctuary of Mattapan, where I started to wonder if I could build some kind of measure of the accessibility and usability of Boston’s open spaces.


")


")
")
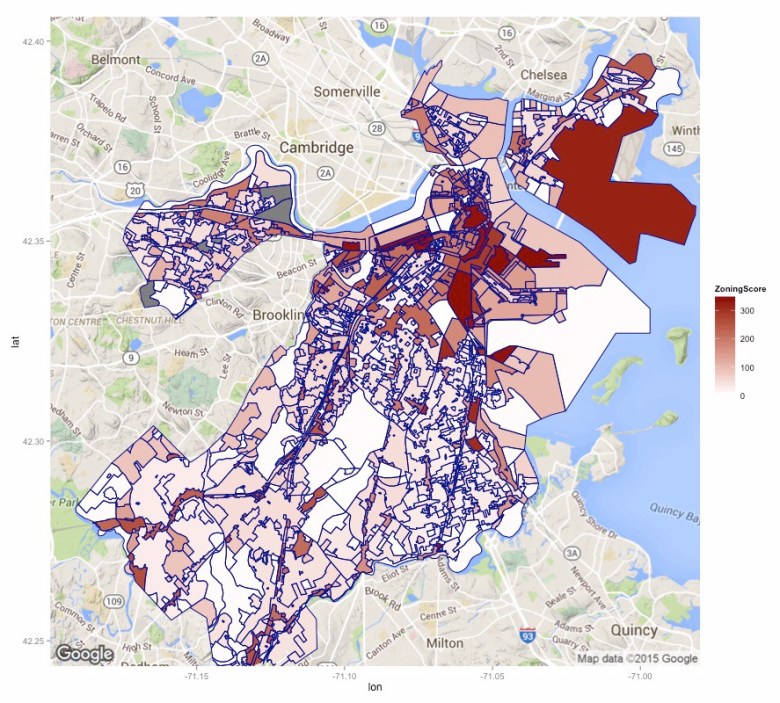
I measured the averages of different types of uses for each area and tried mapping them to see if I could discern any location patterns that might indicate what made an open space usable.
I visited locations in East Boston in residential, mixed res/bus, and industrial areas to see if any patterns emerged, and saw firsthand the value of taking a walk, and getting your head out of the data: the industrial area park I visited, expecting a low-traffic urban wild, was bustling: families taking afternoon walks, neighbors chatting while they walked their dogs. You see, it was only an industrial area on the Boston side: the park also borders heavily residential neighborhoods of Winthrop and Revere, cities that weren’t part of my data set.


I aggregated data down to the NSA (Neighborhood Statistical Area) level to run tests with census data like demographics, income, home-ownership, etc. I spent a lot of time practicing my R skills, but nothing I did gave me quite what I was looking for. However, in researching for my final foray out into the city (Central Artery), something clicked for me.


I wasn’t going to find what I thought I was looking for. In many ways my subject matter, open space, was the opposite of the zoning data. I was taking a data set entirely about development and trying to use it to find something out about areas that are, by definition, undeveloped. But that was itself my answer. It goes back to that blue stripe:
The zoning clearances are about development. Allowances make it easy for individuals, businesses, and other entities to do what they want to do with a space. Forbidden and conditional statuses create roadblocks, requiring public discussion and buy-in to win a variance that will allow them to do what they want, so oftentimes what is forbidden, or how much is forbidden, can tell you more than what is allowed. As Article 33 of the Boston Zoning Code which deals specifically with Open Space Subdistricts says:
“The open space district and nine open space subdistricts, taken together, present a comprehensive means for protecting and conserving open spaces through land use regulations. The open space (OS) designation and an open space subdistrict designation can be used in conjunction with each other, thus establishing for the land so designated the particular restrictions of one of the subdistricts: community garden, parkland, recreation, shoreland, urban wild, waterfront access area, cemetery, urban plaza, or air-right.”
For all the (certainly at times justified) complaints about the byzantine nature of the Zoning Code, there is a logic to the way it is set up. In the Zoning Score measure I created, the higher the score, the more is allowed in the location. Open spaces generally have the lowest possible score. It is no mistake that the Open Space subdistricts are so limited. Residential areas have a lot more forbidden types than allowed as well, and this is no mistake either. For something to be built in a residential neighborhood should be harder than in an industrial zone – the community should have a chance to weigh in as happens when a business owner or developer applies for a variance through the Zoning Board of Appeals.
Open spaces are zoned for almost nothing. Intentionally. Open spaces are forbidden for everything but open space specifically to keep them open because generations of Boston planners have believed that to be a public good.
“The enjoyment of scenery employs the mind without fatigue and yet exercises it; tranquilizes it and yet enlivens it; and thus, through the influence of the mind over the body gives the effect of refreshing rest and reinvigoration to the whole system.”
“For the same reason that the water of rivers should be guarded against private appropriation and the use of it for the purpose of navigation and otherwise protected against obstruction, portions of the natural scenery may therefore properly be guarded and cared for by government…The establishment by government of great public grounds is thus justified and enforced as a public duty.”
Frederick Law Olmsted
“This concept design is as significant to the City as the 19th century establishment of Olmsted’s Emerald Necklace Plan and the 20th century development of the Charles River Esplanade and the Southwest Corridor Transitway/Park Project. During the later 19th and early 20th centuries, a generation of Bostonians made the investment in a visionary concept for the City’s future and its open space system through developing an extraordinary array of parks, boulevards, and esplanades. The City’s leaders aspired to create a common ground where people from all levels of society could mix and be restored and invigorated by the natural realm. Following that tradition, the concept design proposes a sequence of park spaces which will…simultaneously serve visitors from afar, workers from the downtown, and residents from adjacent neighborhoods.”
Boston Redevelopment Authority, “Boston 2000” Plan (1991), conceiving of the Rose Kennedy Greenway as a replacement for the Central Artery
