Dynamic modeling is an extremely useful tool to guide decision-making in all kinds of areas from economics to business development to medical research to environmental engineering. I used my elective for the Urban Informatics program to take this course which used the modeling software Stella.
Working through a model, with its graphical language, helps to lend clarity to consideration of complex, dynamic questions.
With a background skewing more toward foreign policy and national security than engineering and biology, I chose to create a simple radicalization model for my semester project to look at the dynamics at play in recruitment to extremist organizations such as terrorist groups, white supremacist groups, or anti-government militias. In creating my model, I used two basic types of models: a population cohort model and an infectious disease model.
Population cohort:
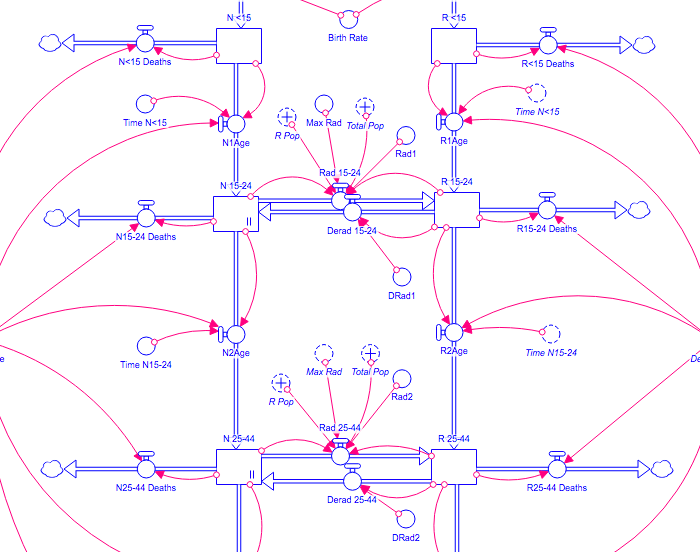
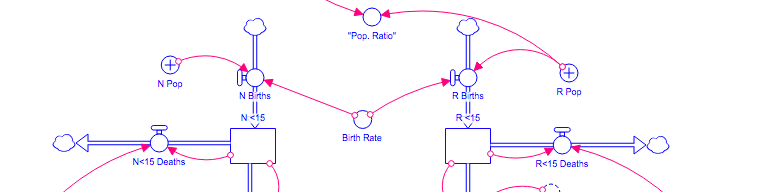
Since different age groups have different levels of susceptibility to both radicalization and de-radicalization, they can’t all be treated the same. Furthermore there are separate population stocks for radicalized and non-radicalized individuals. Each age group has its own radicalization and de-radicalization rates, and each population cohort ages into the next at a standard rate, and loses population at a standard death rate based on the international average. There is also an influx of population via a birth rate based on the international average.
Infectious Disease Model:
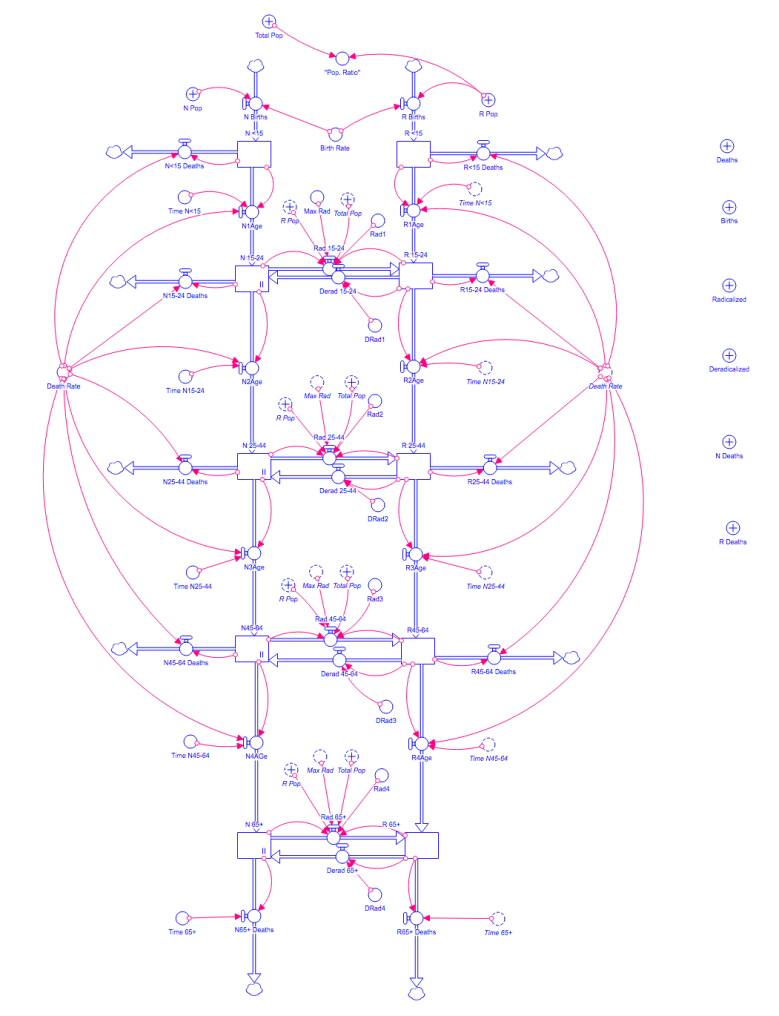
The youngest population cohort exists simply to feed into the older cohorts, but all cohorts from age 15 and up have radicalization and de-radicalization flows.
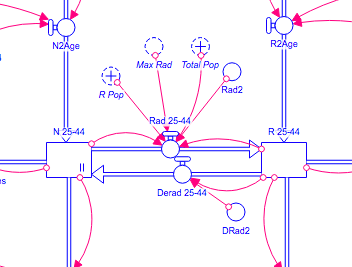
The radicalization flows are the product of the two populations and a radicalization rate, and are capped by a carrying capacity in the form of a maximum radicalization. (This based on an assumption that a large portion of the population tends to remain neutral/self-interested, and some portion of the population will never be susceptible to radicalization by any given group). The de-radicalization flows are based on a simple de-radicalization rate.
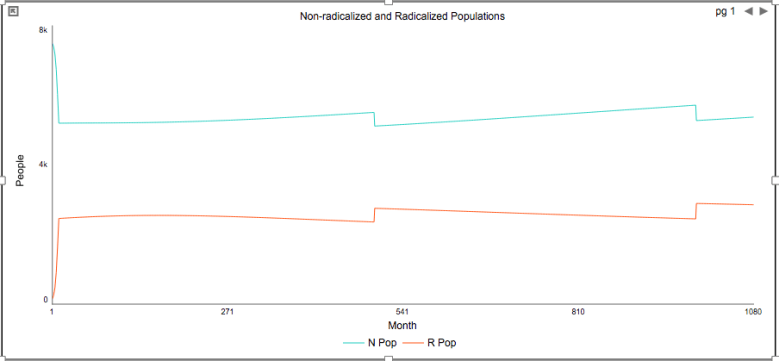
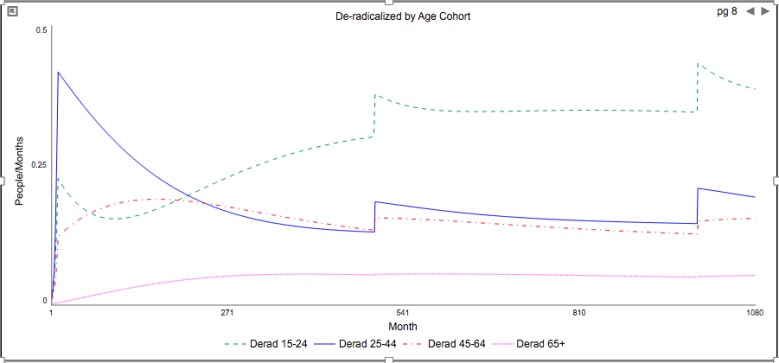
One of the great things about Stella is that the interface allows you to easily experiment with the settings for all of these rates, populations, etc. to see how adjustments to these initial numbers – which can be wholly theoretical – will affect the dynamics of the model. In some cases, minuscule changes can make a dramatic difference. You are also able to quickly generate tables, graphs, etc. of your model output. The following graphs show output from my model when the de-radicalization rate is higher than the radicalization rate – not the default set-up, but easy enough to view using the interface.
I really enjoyed working with Stella on this project, and am happy to have it as part of my toolkit. Below is a look at my full final model.